


A report object is composed of a report dataset and a visual layout. You design a report by first defining the dataset and then designing the visual layout. You design the dataset for reports in Microsoft Dynamics NAV Report Dataset Designer and design the layout in Visual Studio Report Designer. After you design a report, you can make it available to applications that are running on the Microsoft Dynamics NAV Windows client. A report can be designed from one table or multiple tables. This walkthrough demonstrates how to design a report from multiple tables.
 About This Walkthrough
This walkthrough shows you how to design a report by using Report Dataset Designer and Visual Studio Report Designer.
This walkthrough illustrates the following tasks:
- Defining the dataset for multiple
tables.
- Defining properties for the data
items.
- Adding fields to a data item.
- Adding labels to a report.
- Design a client report definition (RDLC)
report layout in Visual Studio 2010.
- Setting filters to hide empty rows and fields
in a report.
- Building and running a report.
Prerequisites
To complete this walkthrough, you will need:
- Microsoft Dynamics NAV 2013 installed with a
developer license.
- The CRONUS International Ltd. demonstration
database installed.
- Microsoft Visual Studio 2010
installed.
Story
Viktor is a developer who is working for CRONUS International Ltd. Viktor has been asked by his manager to create a report that shows data from the Customer (18), Cust. Ledger Entry (21), Detailed Cust. Ledger Entry (379), and the Sales Header (36) tables. The report should meet the following requirements:
- The report should display customer
information at the top of the report.
- For each customer, the report should show a
list of ledger entries.
- For each ledger entry, the report should show
a list of detailed ledger entries under the ledger
entries.
- The report should display basic sales
document headers information for the selected customer.
- Each section of the data for each customer
should begin on a new page.
- The Amount field from the Cust.
Ledger Entry table should be totaled and displayed for each
customer.
- If there are no records to display, the
report should not display that data sections. For example, if there
are no sales documents for a customer, the sale header section
should be skipped.
- Amount fields must not display zero
values.
- The orientation of the report should be
landscape.
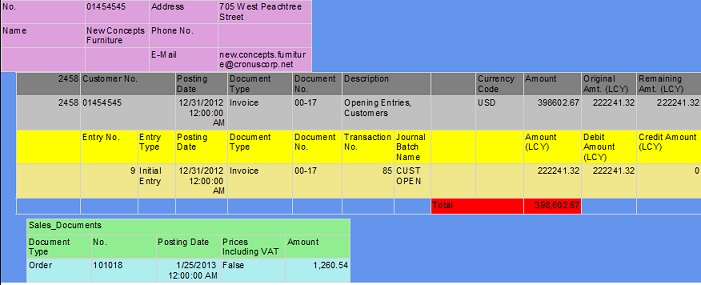
The following illustration shows an example of the second page of the report.
Defining the Dataset
In this task, Viktor will create the dataset that will display customers and their transaction details. The datasets for the data model will come from four tables. Viktor will create a data item for each for table.
To define the dataset
-
In the Microsoft Dynamics NAV Development Environment, on the main menu, choose Tools, and then choose Object Designer.
-
In Object Designer, choose Report, and then choose New to open Report Dataset Designer.
-
In Report Dataset Designer, select the first row, in the Data Type field verify that DataItem is selected. In the Data Source field, choose the up arrow, select the Customer table (18), and then choose the OK button.
-
On the next row, in the Data Type field, choose DataItem, in the Data Source field choose the AssistEdit button, select Cust. Ledger Entry (21) table from the Table List window, and then choose the OK button. This row is automatically indented under the first row. This means that for each customer record, all the records in the Customer Ledger Entries table will be displayed.
-
On the next row, in the Data Type field, choose DataItem, in the Data Source field, choose the AssistEdit button, select the Detailed Cust. Ledg. Entry (379) table, and then choose the OK button. Note that this row is automatically indented under the second row.
-
On the next row, in the Data Type field, select DataItem, in the Data Source field, choose the AssistEdit button, select the Sales Header (36) table, and then choose the OK button.
-
Use the left arrow to indent the row two times to the left so that the row is at the same level as Cust. Ledger Entry (21) data item.
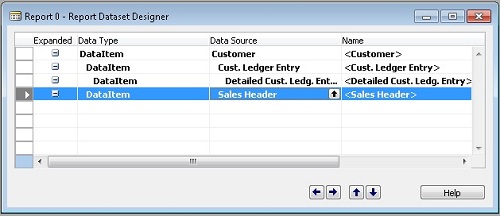
The following illustration shows an example of the Report Dataset Designer after you have added the data items.
Defining Properties for the Data
Items
Now that the data set is defined, Viktor will define the properties of data items.
To define properties for the data items
-
Select the Customer data item, and then on the View menu, choose Properties.
-
In the Properties window, locate the DataItemTableView Property, and then choose the AssistEdit button in the Value field to open the Table View window.
-
In the Key field, choose the up arrow, select No. from the Customer-Key List window, choose the OK button, and then in the Table View window, choose the OK button.
-
Locate the ReqFilterFields Property, choose the AssistEdit from the Value field to open the Fields List window.
-
In the Field List window, choose the up arrow, choose No. from the Customer - Fields List window, choose the OK button, and then choose the OK button in the Field List window.
-
Locate the PrintOnlyIfDetail Property and set the Value field to Yes.
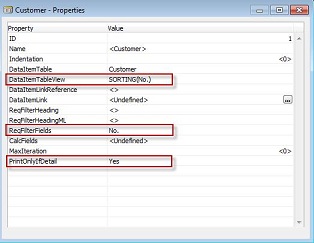
The following illustration shows the properties window for the Customer data item.
-
In Report Dataset Designer, select the Cust. Ledger Entry data item.
-
In the Properties window, locate the DataItemTableView Property, and then choose the AssistEdit button in the Value field to open the Table View window.
-
In the Key field, choose the up arrow, select Entry No. from the Cust. Ledger Entry Key List window, choose the OK button, and then in the Table View window, choose the OK button.
-
Locate the DataItemLink Property (Reports) and choose the AssistEdit button to open the DataItem Link window.
-
In the first row, in the Field column, choose the up arrow. In the Cust. Ledger Entry-Field List window, select Customer No., and then choose the OK button.
-
In the Reference Field column, select the up arrow. In the Customer - Field List window, select No., choose the OK button, and then choose the OK button in the DataItemLink window.
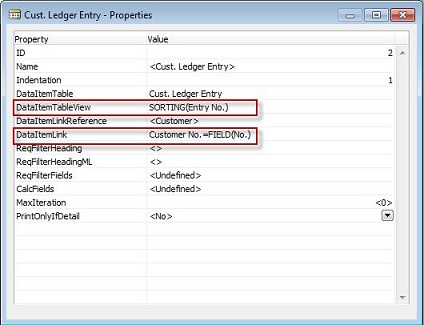
The following illustration shows the Properties window for the Cust. Ledger Entry data item.
-
Select the Detailed Cust. Ledg. Entry data item.
-
In the Properties window, locate the DataItemTableView Property, choose the AssistEdit button in the Value field to open the Table View window.
-
In the Key field, choose the up arrow, select Entry No. from the Detailed Cust. Ledger Entry Key List window, and then choose the OK button. In the Table View window, choose the OK button.
-
Locate the DataItemLink Property (Reports) and choose the AssistEdit button to open the DataItem Link window.
-
In the Field column, choose the up arrow. In the Detailed Cust. Ledg. Entry-Field List window, select Cust. Ledger Entry No., and then choose the OK button.
-
In the Reference Field column, select the up arrow, in the Cust. Ledger Entry-Field List window, select Entry No., and then choose the OK button.
-
In the second row, in the Field column, select the up arrow. In the Detailed Cust. Ledg. Entry-Field List window, select Customer No., and then choose the OK button.
-
In the Reference Field column, select the up arrow. In the Cust. Ledger Entry-Field List window, select Customer No., choose the OK button, and then choose the OK button.
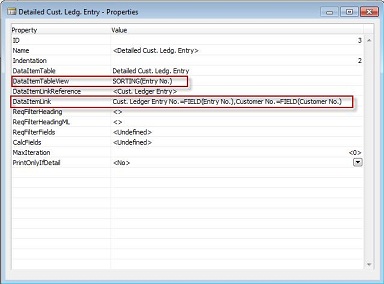
The following illustration shows the Properties window for the Detailed Cust. Ledg. Entry data item.
-
Select the Sales Header data item.
-
Locate the DataItemTableView Property and choose the AssistEdit button to open the Table View window.
-
In the Key field, choose the up arrow, select Document Type,No. from the Sale Header - Key List window, and then choose the OK button. In the Table View window, choose the OK button.
-
Locate the DataItemLink Property (Reports), choose the AssistEdit button to open the DataItem Link window.
-
In the Field column, select the up arrow. In the Sales Header-Field List window, select Sell-to-Customer No., and then choose the OK button.
-
In the Reference Field column, select the up arrow, in the Customer-Field List window, select No., choose OK and then choose the OK button.
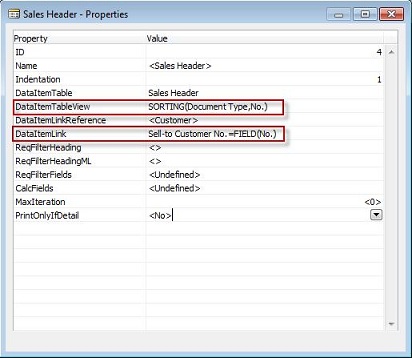
The following illustration shows the Properties window for the Sales Header data item.
-
Close the Properties window.
Adding Fields to the Data Items
Viktor will now add the fields to the data items. For each table, he will add the fields that he wants to display on the report.
To add fields to the data items
-
In Report Dataset designer, select the Customer data item, on the View menu, choose Field Menu.
-
In the Field Menu window, select the following fields, and then choose the OK button. The following table shows the fields in Report Dataset Designer.
Field to select Name No.
No_Customer
Name
Name_Customer
Address
Address_Customer
Phone No.
PhoneNo_Customer
E-Mail
EMail_Customer
 Note
NoteYou can hold down the Ctrl key to select multiple fields. -
Choose the OK button and then choose Yes at the prompt.
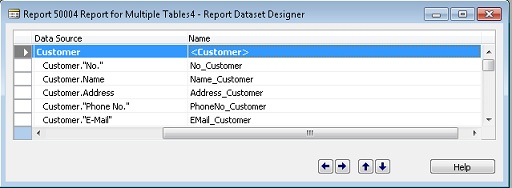
The following illustration shows the Customer data item with its fields in Object Designer.
-
Select the Cust. Ledger Entry data item and repeat steps 1 through 3 to add the fields. The following table shows the fields in Report Dataset Designer.
Field to select Name Entry No.
EntryNo_CustLedgerEntry
Customer No.
CustomerNo_CustLedgerEntry
Posting Date
PostingDate_CustLedgerEntry
Document Type
DocumentType_CustLedgerEntry
Document No.
DocumentNo_CustLedgerEntry
Description
Description_CustLedgerEntry
Currency Code
CurrencyCode_CustLedgerEntry
Amount
Amount_CustLedgerEntry
Original Amt (LCY)
OriginalAmtLCY_CustLedgerEntry
Remaining Amt. (LCY)
EntryType_DetailedCustLedgEntry
-
Select the Detailed Cust. Ledger Entry data item and repeat steps 1 through 3 to add the fields. The following table shows the fields in Report Dataset Designer.
Field to select Name Entry No.
EntryNo_DetailedCustLedgEntry
Entry Type
EntryType_DetailedCustLedgEntry
Posting Date
PostingDate_DetailedCustLedgEntry
Document Type
DocumentType_DetailedCustLedgEntry
Document No.
DocumentNo_DetailedCustLedgEntry
Amount (LCY)
AmountLCY_DetailedCustLedgEntry
Transaction No.
TransactionNo_DetailedCustLedgEntry
Journal Batch Name
JournalBatchName_DetailedCustLedgEntry
Debit Amount (LCY)
DebitAmountLCY_DetailedCustLedgEntry
Credit Amount (LCY)
CreditAmountLCY_DetailedCustLedgEntry
-
Select the Sales Header data item and repeat steps 1 through 3 to add the fields. The following table shows the fields in Report Dataset Designer.
Field to select Name Document Type
DocumentType_SalesHeader
No.
No_SalesHeader
Posting Date
PostingDate_SalesHeader
Prices Including VAT
PricesIncludingVAT_SalesHeader
Amount
Amount_SalesHeader
-
Select the first field under the Customer data item. On the View menu, choose Properties and then set the IncludeCaption Property of each field to Yes.
-
Repeat step 7 to set the IncludeCaption Property of each field under each DataItem to Yes. Alternatively, you select the Include Caption check box for all the fields. This check box is located in the right corner in Report Dataset Designer.
Adding Labels to the Report
Viktor will now add labels to the report. The label in Report Dataset Designer stores the label values for the report data set.
To add labels to the report
-
On the View menu, choose Labels to open Report Label Designer.
-
In the first row, in the Name field, enter Sales_Document_Caption, and then in the Caption field, enter Sales Documents.
-
In the second row, in the Name field, enter Total_Caption in the Caption field, and then enter Total. Close Report Label Designer.
These labels will be used later as captions in the report.
Viktor will save the report and run it to view how his report looks like at this point.
-
From the File menu, choose Save to open the Save As window.
-
In the ID field, enter 50001 . In the Name field, enter Report for Multiple Tables, Make sure that Compile is selected, and then choose the OK button.
-
In Object Designer, select Report for Multiple Tables (50001), and then choose the Run button to run the report.
The following illustration shows an example of the request page that is displayed when the report is run.
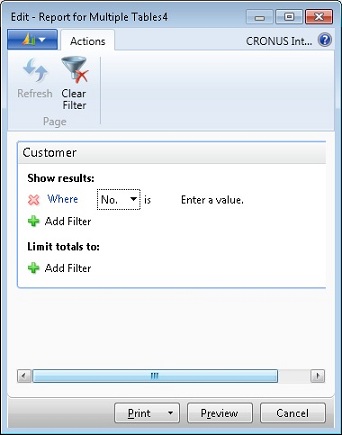
If you choose the Preview button on the request page, the report will display a blank page because a layout for the report is not designed yet.
Designing the Visual RDLC Layout for
the Report
Next, Viktor will design a RDLC layout for the report by using Visual Studio Report Designer. He will set properties for the report and the report elements, format the report, and then add the data to the report.
To design the RDLC layout for the report
-
Choose anywhere inside the Report Dataset Designer. On the View menu, choose Layout to open the RDLC report in Microsoft Visual Studio. The body of the report is displayed in Visual Studio.
-
Right-click anywhere outside the report (in the shaded area) and then choose Add Page Header.
-
Right-click anywhere outside the report (in the shaded area), and then choose Report Properties.
-
In the Report Properties window, choose the Page Setup tab. Iin the Paper size section, under Orientation, choose the Landscape, and then choose the OK button.
-
On the View menu, choose Toolbox to open the Toolbox pane. Select the List control, and then choose the body of the report to add the List control to the report. This control will contain and group all the data.
-
Move the List control to the top of the report body and resize it to cover the whole report body.
-
Right-click the middle of the List controls, and then choose Rectangle Properties.
-
In the Rectangle Properties window, choose the Fill tab, in the Fill Color list color pallet, select Cornflower Blue from the color pallet, and then choose the OK button. You can choose any color.
NoteChanging the color of report elements helps you identify elements on the report preview. You can set different color properties for table header, detail rows, text boxes, and so on. Viktor will set the properties of the List control to hold the dataset, group the data by Customer No. and set up how the groups should be displayed.
To set the list control properties
-
Select the List control, right-click the shaded border to the left of the List control, and then choose Tablix Properties.
-
In the Tablix Properties window, on the General tab, under Dataset name, select DataSet_Result from the drop-down list, and then choose the OK button.
-
Select the List control, right-click the shaded border to the left of the list control, choose Row Group, and then Group Properties.
-
In the Group Properties window, on the General tab, under Group expressions:, choose the Add button, and then select [No_Customer] from the Group on: drop-down list. This groups all the data in the List control by customer number.
-
On the Page Breaks tab, select Between each instance of a group, and then choose the OK button.
Viktor is now ready to add the customer data. The table will display one customer at a time, therefore Viktor must put all the fields into table header rows. The table data and footer rows will be disabled.
To add customer data
-
From the Toolbox pane, drag a Table control into the List control and resize the table to about the half the width of the list control. This table will contain the customer data.
The following illustration shows the list control and the table.
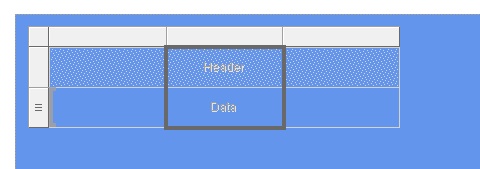
Note that the table contains two table rows, a header row (first row), and a data row (second row). The three parallel lines in the left border of the second row identify the data row.
-
Select any table row, right-click the shaded border, and then choose Tablix Properties to open the Tablix Properties window.
-
On the General tab, verify that the Dataset name field is set to DataSet_Result, and then choose the OK button.
The table has three columns. Viktor will add a fourth column to the table to hold all the customer data.
-
Right-click the middle column header, choose Insert Column, and then select Right to insert the fourth column into the table.
-
Select the second table row (the data row), right-click the row, choose Delete Rows to delete the data row, and then choose the OK button in the Delete Rows window to delete the row and its associated groups.
-
Select the remaining table row, right-click the shaded border on the left, choose Insert Row, and then choose Below to insert another table header row.
-
Repeat step 6 to insert a third table header row. There should now be three header rows in the table.
-
Right-click the first cell (row 1, column 1) in the table, and then choose Expression to open the Expression window.
-
In the Category column, select Parameters, in the Item column, verify that All is selected, and then in the Values column, double-click No_CustomerCaption. Verify that the Set expression for: Value box contains the following value:
=Parameters!No_CustomerCaption.Value. This cell will display the customer No. caption in the report. -
Modify the expression to
=First(Parameters!No_CustomerCaption.Value). Choose the OK button.NoteAll caption fields must begin with =Firstso that the first value for the caption fields in the data set is retrieved and used as caption. If the First function is not used, the report will return the current value for a field. The current value however may be incorrect. For example, the current value could be empty. -
Right-click the second cell (row 1, column 2) in the table, and then choose Expression to open the Expression window.
-
In the Category column, select Field(DataSet_Result), in the Item column verify that All is selected, and then in the Values column double-click No_Customer. Verify that the Set expression for: Value box contains the following value
=Fields!No_Customer.Value. Choose the OK button. This cell will display the Customer No.. -
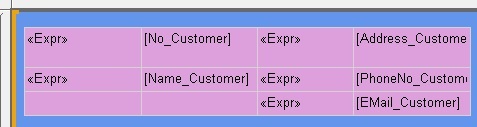
Repeat steps 8 through 12 to the enter captions and values in the following cells.
NoteColumns 1 and 3 will contain the captions and columns 2 and 4 will contain the values. Row Column Caption Value 2
1
Name_CustomerCaption
None
2
2
None
Name_Customer
1
3
Addreess_CustomerCaption
None
1
4
None
Address_Customer
2
3
PhoneNo_CustomerCaption
None
2
4
None
PhoneNo_Customer
3
3
Email_CustomerCaption
None
3
4
None
Email_Customer
-
Select all table rows (not the whole table), and then on the View menu, choose Properties Window to open the Properties window in Visual Studio.
-
In the Properties window, under Fill, set the BackgroundColor property to Plum. You can choose any color.
The layout that Viktor has designed to this point resembles the following illustration.
-
On the Build menu, choose Build Web site to build the project. Inspect the Output pane and make sure that there are no build errors. Close Visual Studio.
NoteIt is a good practice to build the project periodically during the report design to make sure that there are no build errors. Viktor will run the report and preview what he has done to this point.
-
In Microsoft Dynamics NAV Development Environment, in Report Dataset Designer, select a data item. In the dialog box that appears that indicates that the layout of the report is changed by another application, choose the Yes button.
-
On the File menu, choose Save. In the Save window, verify that Compile is selected, and then choose the OK button.
-
In Object Designer, select your report (50001) and then choose the Run button.
-
In the request page that is displayed, choose the Preview button to view the report. The first customer is displayed on the first page. If you page through the report, each customer is displayed on a separate page.
Viktor will now add the data for the customer ledger entries and detailed ledger entries. The entries will be put in a different table.
To add the data for ledger entry and detailed ledger entry
-
Select Report Dataset Designer. On the View menu, choose Layout to open the RDLC report in Microsoft Visual Studio.
-
From the Toolbox, drag a table control into the list control. Put the table under the table that contains the customer data.
NoteYou may have to resize the report body and the list controls to make them larger. -
Select the table, right-click the shaded border, choose Tablix Properties. On the General tab, verify that the Dataset name field is set to DataSet_Result, and then choose the OK button.
-
Select the table data row, choose Insert Row and then choose Outside Group - Below. This adds another data row to the table. You now have one header row and two data rows.
-
Delete the first row (header row) in the table and then insert columns in the table so that the total number of columns is eleven.
-
Choose the first data row, right-click the shaded border to the left, choose Add Group, and then choose Parent Group.
-
In the Tablix group window, select Group by, select EntryNo_CustLedgerEntry from the drop-down list. Select Add group header, and then choose the OK button.
-
Right-click the first row, choose Insert Row, and then choose Inside Group - Above. This header will hold the captions for the Customer Ledger entries.
-
Right-click the cell in the row1, column 2, and then choose Expression to open the Expression window.
-
In the Category column, select Parameters and then in the Values column double-click EntryNo_CustLedgerEntryCaption. Note that the Set expression for: Value box contains the following value:
=Parameters!EntryNo_CustLedgerEntryCaption.Value -
Modify the expression to the following value:
=First(Parameters!EntryNo_CustLedgerEntryCaption.Value). -
Repeat steps 9 through 11 to add captions for the table cells in the rest of the first row as shown in the following table.
Column Caption expression 3
CustomerNo_CustLedgerEntryCaption
4
PostingDate_CustLedgerEntryCaption
5
DocumentType_CustLedgerEntryCaption
6
DocumentNo_CustLedgerEntryCaption
7
Description_CustLedgerEntryCaption
8
Skip this cell. You will use this cell later.
9
CurrencyCode_CustLedgerEntryCaption
10
Amount_CustLedgerEntryCaption
11
OriginalAmtLCY_CustLedgerEntryCaption
12
RemainingAmtLCY_CustLedgerEntryCaption
-
Right-click the left-most grouping cell (the cell that contains the EntryNo_CustLedgerEntry field) in the table, select Text Box Properties, in the Text Box Properties window, select the Visibility tab, under the Change display options, select the Hide option.
-
Select the first row in the table, in the Properties pane, under Fill, set the BackgroundColor property to Dim Grey.
-
Right-click the cell in the row2, column 2, and then choose Expression to open the Expression window.
-
In the Category column, select Fields (DataSet_Result), in the Values column, double-click EntryNo_CustLedgerEntry, and then choose the OK button. Note that the Set expression for: Value box contains the following value:
=Fields!EntryNo_CustLedgerEntry.Value -
Repeat steps 15 and 16 for row 3 to add fields from the ledger entry dataset. Put the fields under the corresponding captions.
-
Select the row that you just filled and set the BackgroundColor property to Silver.
-
Build the project, inspect the Output pane, and make sure that there are no build errors.
-
Select the second table row, right-click the shaded border to the left, choose Insert Row, and then choose Below. The table should now have three group rows, one group data row, and one table footer row. This row will store the captions of Detailed Cust. Ledg. Entry data item.
-
Add the captions and fields for the Detailed Cust. Ledger Entry table as shown in the following table.
Third row (Caption) Forth row (Fields) EntryNo_DetailedCustLedgEntryCaption
EntryNo_DetailedCustLedgEntry.Value
EntryType_DetailedCustLedgEntryCaption
EntryType_DetailedCustLedgEntry.Value
PostingDate_DetailedCustLedgEntryCaption.
PostingDate_DetailedCustLedgEntr.Value
DocumentType_DetailedCustLedgEntryCaption
DocumentType_DetailedCustLedgEntry.Value
DocumentNo_DetailedCustLedgEntryCaption
DocumentNo_DetailedCustLedgEnt.Value
TransactionNo_DetailedCustLedgEntryCaption
TransactionNo_DetailedCustLedgEntry.Value
JournalBatchName_DetailedCustLedgEntryCaption
JournalBatchName_DetailedCustLedgEntry.Value
AmountLCY_DetailedCustLedgEntryCaption
AmountLCY_DetailedCustLedgEntr.Value
DebitAmountLCY_DetailedCustLedgEntryCaption
DebitAmountLCY_DetailedCustLedgEntry.Value
CreditAmountLCY_DetailedCustLedgEntryCaption
CreditAmountLCY_DetailedCustLedgEntry.Value
-
Shrink the column that contains the Customer No. field of the Cust. Ledger Entry to about half of its size.
-
Right-click the column header that contains the Customer No. field, choose Insert Column, and then choose Right.
-
Select the cell that contains the Customer No. caption and the empty cell that you just created, and then choose Merge Cells to merge the two cells.
-
Repeat step 24 to merge the cell that contains the value of the Customer No. field and the empty cell that you created.
-
Assign the expression from the EntryType caption and field cells of the Detailed Cust. Ledg. Entry to the empty cell that you created to the right. You may have to have to cut the expressions and paste them into the empty cells.
-
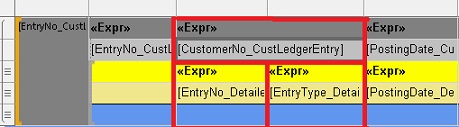
Repeat 26 to move the EntryNo caption and field one cell to the right. This makes sure that the EntryNo and the EntryType data is located directly under the CustomerNo cell.
The following illustration shows EntryNo and the EntryType cells directly under the CustomerNo cell
-
Repeat steps through 27 to put the Transaction No. and Journal Batch Name captions and fields under the Description data. This creates a blank cell under the CurrencyCode field.
-
Select the third row and set the BackgroundColor property to Yellow and then set the BackgroundColor property of the fourth row to Khaki.
Viktor will now hide all empty cells and add the totals to the footer row. To hide empty cells Viktor will add a filter that selects rows that have [EntryNo] value that are greater than zero.
To hide empty cells and add totals
-
Select the first row, right-click the shaded border to the left of the row, choose Row Group, and then choose Group Properties.
-
In the Group Properties window, select the Filters tab, and then choose the Add button.
-
Set Expression to [EntryNo_CustLedgerEntry], change Text to Integer, set Operator to >, set Value to 0, and then choose the OK button.
The filter that is set applies to the other rows in the table.
-
In the Group Properties window, under the Filters tab, verify that the Expression box contains [EntryNo_CustLedgerEntry].
Viktor will now add the total of the amount field to the footer row of the table, format the cells and hide the total cell if customer ledger entry is not available.
-
In the last row of the table, right-click the empty cell under the Amount (LCY) field, and then choose Expression.
-
In the Category column, select Fields (DataSet_Result), in the Values column double-click Amount_CustLedgerEntry, and then change the expression in the Set expression for: Value box to the following value:
=Sum(Fields!Amount_CustLedgerEntry.Value). Choose the OK button. -
In the Properties window, locate the Format property, choose the drop-down arrow and select Expression.
-
In the Expression window, enter the following formatting expression in Set expression for: Value box:
=Fields!Amount_CustLedgerEntryFormat.Value. Choose the OK button.NoteAlternatively, you set this value by double-clicking Amount_CustLedgerEntryFormat in the Values field of Fields(DataSet) category. -
Select the two empty cells to the left of the total cell, right-click the cells, and then choose Merge Cells.
-
Right-click the merged cell, choose Expression, choose the Parameters category, and then set the caption to Total_Caption
-
Set the BackgroundColor property of the cells that contain the total and total caption to Red.
If you run the report now, the total amount cell will be displayed even if there are no ledger entries. Viktor will add an expression to hide the footer row when there are no ledger entries.
-
Select the last row, in the Properties window, locate the Hidden property, choose the drop-down arrow, and then choose Expression.
-
In the Expression window, in the Set expression for: Hidden box, enter the following expression to hide the row:
=Fields!EntryNo_CustLedgerEntry.Value = 0. Choose the OK button. This hides the row if there are no entry values. -
Right-click the left-most cell in the last table row, select Text Box Properties, select the Visibility tab, under Change display options, select the Hide option, and then choose the OK button.
The next step is to add the data from the Sales Header table.
To add the sales header data
-
From the Toolbox, drag a Table control to the List control, and then put the table control under the table that contains the Cust. Ledger Entry table
-
Right-click a column and add columns to create five columns for the table.
-
Delete the first header row from the table.
-
Right-click the data row, choose Tablix Properties, verify that the DataSet name is set to DataSet_Result, and then choose the OK button.
-
Right-click the data row, choose Add Group, and then choose Parent Group to open the Tablix group window.
-
Select the Group by: option and then choose the fx button to open the Expression window.
-
In the Category column, select Parameters, and then in the Values, column double-click Sales_Document_Caption. Verify that the Set expression for: Value box contains the following value:
=Parameters!Sales_Document_Caption.Value. Choose the OK button. -
In the Tablix group window, select Add group header, and then choose the OK button.
-
Right-click the first row in the table, choose Insert Row, and then choose Inside Group - Above.
-
Reduce the size of the first column, and then in the Properties window, under Visibility, set the Hidden property to True. This hides the first column.
-
In the first table row, merge all the cells except the first grouping cell.
-
Right-click the merged cell, and then choose Expression.
-
In the Category column, select Parameters, and then in the Values column double-click Sales_Document_Caption. Verify that the Set expression for: Value box contains the following value:
=Parameters!Sales_Document_Caption.Value. Choose the OK button. -
Modify the expression to
=First(Parameters!Sales_Document_Caption.Value). -
Right-click the cell in row2, column 2, and then choose Expression to open the Expression window.
-
In the Category column, select Parameters, and then in the Values column double-click DocumentType_SalesHeader. Verify that the Set expression for: Value box contains the following value:
Parameters!DocumentType_SalesHeaderCaption.Value -
Modify the expression to the following value:
=First(Parameters!DocumentType_SalesHeaderCaption.Value). Choose the OK button. -
Right-click the cell that is under the caption that you just created, choose Expression. In the Category column, select Fields (DataSet_Result), and then in the Values column double-click DocumentType_SalesHeader. Choose the OK button. Verify that the Set expression for: Value box contains the following value:
=Fields!DocumentType_SalesHeader.Value -
Repeat steps 15 through 18 and add the following captions and the corresponding fields.
Caption Corresponding field No_SalesHeaderCaption
No_SalesHeader
PostingDate_SalesHeaderCaption
PostingDate_SalesHeader
PricesIncludingVAT_SalesHeaderCaption
PricesIncludingVAT_SalesHeader
Amount_SalesHeaderCaption
Amount_SalesHeader
-
Select the first two rows and in the Properties window, set the BackgroundColor property to Lime.
-
Select the data row (last row), in the Properties window, set the BackgroundColor property to Turquoise.
Viktor will now set a filter that hides empty rows.
To set a filter hide empty row
-
Select any row from this table, right-click the shaded border to the left of the table, and then choose Tablix Properties.
-
Choose the Filters tab and then choose the Add button.
-
In the Expression list box, select No_SalesHeader, set Operator to >, set Value to 0, and then choose the OK button.
-
Save the report.
Building and Running the Report
Before you run the report, you must build and correct all build errors and then run the run report in Object Designer.
To build and run the report
-
In the main menu, choose Build, and then choose Build Web Site to build the project. Inspect the Output pane and make sure that there are no build errors and then close Visual Studio.
-
In development environment, in Report Dataset Designer, select a data item, and then in the dialog box that appears that indicates that the layout of the report is changed by another application, choose the Yes button.
-
On the File menu, choose Save. In the Save window, make sure that Compile is selected, and then choose the OK button.
-
In Object Designer, select the report (50001), and then choose the Run button to run the report.
-
On the request page, choose the Preview button to view the report.
-
Use the paging buttons at the top of the report to move to the next customer.
Next Steps
Viktor can add advanced features to the report. He can add features such as displaying the company name and logo on every page on the report. He might also want to add features that enable users to apply filters on the request page. For more information, see Walkthrough: Adding Company Information, Custom Filters, and Formatting to a Report.