This code example demonstrates how to use the Business Data Chart control add-in to create a chart that displays a cash flow forecast as shown in the following figure:
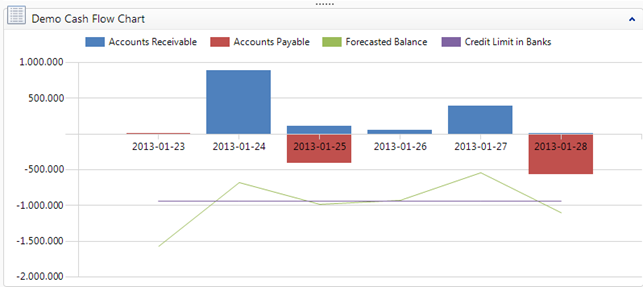
The cash flow forecast chart combines the current bank balances with the outstanding receivables and payables, and displays the data for the next six days, including the current day. The chart displays data for four measures: Accounts Receivable, Accounts Payable, Forecasted Balance, and Credit Limit in Banks. The data for the measures is displayed using the following chart types: stacked column, line, and step line.
The chart is interactive. When you choose a data point, a list appears that shows overdue customer ledger entries, vendor ledger entries, or bank accounts.
Cash Flow Chart Design
The chart is designed around enhanced performance, testability, and code reuse. The chart design separates the business logic and data handling from the chart rendition on the page. This improves performance because you can run the business logic on the computer running the Microsoft Dynamics NAV Server instead of the Microsoft Dynamics NAV Windows client and limit the data calls between the client and server. The cash flow chart uses Microsoft .NET Interoperability to call Microsoft .NET Framework types from Microsoft Dynamics NAV objects to build the chart and populate it with data.
The following figure illustrates the Microsoft Dynamics NAV objects that are used to create the cash flow chart.
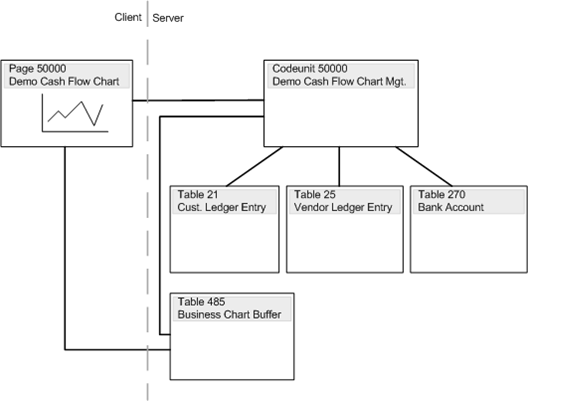
Page 50000 Demo Cash Flow Chart contains the Business Data Chart control add-in that renders the chart user-interface on the page. The Business Data control add-in is defined by the Microsoft.Dynamics.Nav.Client.BusinessChart assembly that is available by default in the Microsoft Dynamics NAV installation.
Table 485 Business Chart Buffer temporarily holds the data for building the cash flow chart, such as the chart type, measures, and labels. The data is retrieved by page 50000 and passed to the Business Data Chart control add-in. Table 485 is a default table that is available with the Microsoft Dynamics NAV demo database. The table uses Microsoft .NET Framework interoperability to reference types in the System.Data assembly for building a data table that contains the chart data. You can use this table with other charts that are built on the Business Data control add-in.
Codeunit 50000 Demo Cash Flow Chart Mgt. contains the business logic for the cash flow chart and generates the data that is displayed in the chart.
Creating the Page for Displaying the Chart
The following code creates a CardPart type page that includes the Business Data Chart control add-in and the C/AL for displaying data. To create the page, copy the code to a text file, and then, in the Microsoft Dynamics NAV development environment, import the text file. After you create the page, you can use it in the Microsoft Dynamics NAV Windows client. For example, you can add it in a part on the Role Center page.
 Copy Code Copy Code |
|
|---|---|
OBJECT Page 50000 Demo Cash Flow Chart
{
  OBJECT-PROPERTIES
  {
	Date=18-04-12;
	Time=15:57:04;
	Modified=Yes;
	Version List=;
  }
  PROPERTIES
  {
  }
  CONTROLS
  {
	{ 1   ; ;Container ;
				Name=Content;
				ContainerType=ContentArea }
	{ 2   ;1   ;Field	 ;
				Name=Chart;
				ControlAddIn=[Microsoft.Dynamics.Nav.Client.BusinessChart;PublicKeyToken=31bf3856ad364e35] }
  }
  CODE
  {
	VAR
	BusinessChartBuffer@1000 : Record 485;
	DemoCashFlowChartMgt@1001 : Codeunit 50000;
	LOCAL PROCEDURE UpdateChart@2();
	BEGIN
	DemoCashFlowChartMgt.GenerateData(BusinessChartBuffer);
	BusinessChartBuffer.Update(CurrPage.Chart);
	END;
	EVENT Chart@-2::DataPointClicked@12(point@1000 : DotNet "'Microsoft.Dynamics.Nav.Client.BusinessChart.Model, Version=7.0.0.0, Culture=neutral, PublicKeyToken=31bf3856ad364e35'.Microsoft.Dynamics.Nav.Client.BusinessChart.BusinessChartDataPoint");
	BEGIN
	BusinessChartBuffer.SetDrillDownIndexes(point);
	DemoCashFlowChartMgt.OnDataPointClicked(BusinessChartBuffer);
	END;
	EVENT Chart@-2::DataPointDoubleClicked@13(point@1000 : DotNet "'Microsoft.Dynamics.Nav.Client.BusinessChart.Model, Version=7.0.0.0, Culture=neutral, PublicKeyToken=31bf3856ad364e35'.Microsoft.Dynamics.Nav.Client.BusinessChart.BusinessChartDataPoint");
	BEGIN
	END;
	EVENT Chart@-2::AddInReady@14();
	BEGIN
	UpdateChart;
	END;
	BEGIN
	END.
  }
}
OBJECT Page 50000 Demo Cash Flow Chart
{
  OBJECT-PROPERTIES
  {
	Date=06-04-12;
	Time=12:22:59;
	Modified=Yes;
	Version List=;
  }
  PROPERTIES
  {
  }
  CONTROLS
  {
	{ 1;;Container;
				Name=Content;
				ContainerType=ContentArea }
	{ 1000000001;1;Field  ;
				Name=Chart;
				ControlAddIn=[Microsoft.Dynamics.Nav.Client.BusinessChart;PublicKeyToken=31bf3856ad364e35];
				OnControlAddIn=BEGIN
								 IF Index = 0 THEN
								 UpdateChart;
							 END;
				OnDataPointClicked=VAR
									 StringArr@1000000002 : DotNet "'mscorlib, Version=2.0.0.0, Culture=neutral, PublicKeyToken=b77a5c561934e089'.System.String";
									 wt@1000000003 : Text;
								 BEGIN
									 CashFlowChartMgt.OnDataPointClicked(BusinessChartBuffer,point.ToString);
								 END;
				OnDataPointDoubleClicked=BEGIN
										 END;
									}
  }
  CODE
  {
	VAR
	BusinessChartBuffer@1000000000 : Record 485;
	CashFlowChartMgt@1000000001 : Codeunit 50000;
	LOCAL PROCEDURE UpdateChart@1000000000();
	VAR
	BusinessChartData@1000000000 : DotNet "'Microsoft.Dynamics.Nav.Client.BusinessChart, Version=7.0.0.0, Culture=neutral, PublicKeyToken=31bf3856ad364e35'.Microsoft.Dynamics.Nav.Client.BusinessChart.BusinessChartData";
	BEGIN
	CashFlowChartMgt.GenerateData(BusinessChartBuffer);
	BusinessChartBuffer.GetChartData(BusinessChartData);
	CurrPage.Chart.Update(BusinessChartData);
	END;
	BEGIN
	END.
  }
}
|
|
Understanding the Page Code
The following list explains some of the page’s C/AL code:
- The page includes a single field that has its
ControlAddin Property set to
the Microsoft.Dynamics.Nav.Client.BusinessChart assembly, which
defines the Business Data Chart control add-in.
- The
Updatefunction populates the chart with data from the Business Chart Buffer table. TheChart - AddinReadytrigger calls theUpdatefunction when the Business Chart control add-in is loaded and ready on the page. Depending on your scenario, you could also call theUpdatefunction on the OnAfterGetRecord trigger, OnFind trigger, or on an action. - The business logic has been isolated in
codeunit 50000 Demo Cash Flow Chart Mgt. The page includes
the Business Chart Buffer record variable that references
table 485 Business Chart Buffer. The Business Chart
Buffer record variable holds the chart data and updates the
control add-in when it is passed into the function Update. Note
that we pass on CurrPage.Chart, for example, the chart add-in to
the function. The Microsoft.Dynamics.Nav.Client.BusinessChartData
object is defined by a DotNet variable. The DotNet variable for the
BusinessChartData object is configured to instantiate on the
computer running the Microsoft Dynamics NAV Server. This populates
the object with data and properties without having the server
calling the client. After the chart data has been generated, it is
delivered to the Business Data chart control add-in in a single
call. The data that is transferred between the Microsoft Dynamics
NAV Server and the Microsoft Dynamics NAV Windows client is
automatically serialized. For more information, see Serializing .NET Framework
Types.
- The OnDataPointClicked trigger is
called when you choose a data point or column in the cash flow
chart. Depending on the data point or column that you choose, a
list page appears that shows overdue customer ledger entries,
vendor ledger entries or bank accounts. To improve code
testability, the drill-down logic for the OnDataPointClicked
trigger is called from codeunit 50000 Demo Cash Flow Chart
Mgt. This construction allows you to test the data generation
and drill-down from code by calling functions on the
codeunit.
Creating the Codeunit for Handling Data
The following code creates codeunit 50000 Demo Cash Flow Chart Mgt. To create the codeunit, copy the code to a text file, and then, in the development environment, import the text file.
| Copy Code |
|
|---|---|
OBJECT Codeunit 50000 Demo Cash Flow Chart Mgt.
{
  OBJECT-PROPERTIES
  {
	Date=18-04-12;
	Time=16:11:09;
	Modified=Yes;
	Version List=Charts;
  }
  PROPERTIES
  {
	OnRun=BEGIN
		END;
  }
  CODE
  {
	VAR
	TextCust@1000 : TextConst 'ENU=Accounts Receivable';
	TextVend@1001 : TextConst 'ENU=Accounts Payable';
	TextBank@1002 : TextConst 'ENU=Bank Balances';
	TextTotal@1003 : TextConst 'ENU=Forecasted Balance';
	TextCredit@1004 : TextConst 'ENU=Credit Limit in Banks';
	TextDate@1005 : TextConst 'ENU=Date';
	PROCEDURE OnInitPage@6(VAR BusChartBuf@1000 : Record 485);
	BEGIN
	END;
	PROCEDURE GenerateData@3(VAR BusChartBuf@1000 : Record 485);
	VAR
	i@1007 : Integer;
	BankBalance@1006 : Decimal;
	CustNetChange@1005 : Decimal;
	VendNetChange@1004 : Decimal;
	TotalBalance@1003 : Decimal;
	BalanceDate@1002 : Date;
	BankCreditLimit@1001 : Decimal;
	BEGIN
	WITH BusChartBuf DO BEGIN
		Initialize;
		AddMeasure(TextCust,1,"Data Type"::Decimal,"Chart Type"::StackedColumn);
		AddMeasure(TextVend,2,"Data Type"::Decimal,"Chart Type"::StackedColumn);
		AddMeasure(TextTotal,3,"Data Type"::Decimal,"Chart Type"::Line);
		AddMeasure(TextCredit,4,"Data Type"::Decimal,"Chart Type"::StepLine);
		SetXAxis(TextDate,"Data Type"::DateTime);
		BalanceDate := WORKDATE - 1; // demo. Should be TODAY.
		CalcBankBalance(BalanceDate,TotalBalance,BankCreditLimit);
		FOR i := 1 TO 6  DO BEGIN  //  Generate 6 columns
		CustNetChange := CalcCustNetChange(BalanceDate,BalanceDate);
		VendNetChange := CalcVendNetChange(BalanceDate,BalanceDate);
		TotalBalance := TotalBalance + CustNetChange + VendNetChange;
		AddPeriodColumn(BalanceDate);  // X-Axis value
		SetValueByIndex(1 - 1,i - 1,CustNetChange); // zero indexed.
		SetValueByIndex(2 - 1,i - 1,VendNetChange);
		SetValueByIndex(3 - 1,i - 1,TotalBalance);
		SetValueByIndex(4 - 1,i - 1,BankCreditLimit);
		BalanceDate := BalanceDate + 1;
		END;
	END;
	END;
	PROCEDURE OnDataPointClicked@5(VAR BusChartBuf@1000 : Record 485);
	VAR
	VendLedgEntry@1001 : Record 25;
	DrillDownDate@1000000001 : Date;
	BEGIN
	DrillDownDate := WORKDATE + BusChartBuf."Drill-Down X Index" + 1; // ref. first balance date in GenerateData function
	CASE BusChartBuf."Drill-Down Measure Index" + 1 OF
		1 : // Customer
		DrillDownCust(DrillDownDate);
		2 : // Vendor
		DrillDownVend(DrillDownDate);
		4 : // Bank Credit limits
		DrillDownBank;
	END;
	END;
	LOCAL PROCEDURE CalcCustNetChange@1(FromDate@1000 : Date;ToDate@1001 : Date) : Decimal;
	VAR
	CustLedgEntry@1002 : Record 21;
	TotalRemainingAmount@1003 : Decimal;
	BEGIN
	WITH CustLedgEntry DO BEGIN
		SETCURRENTKEY(Open,"Due Date");
		SETRANGE(Open,TRUE);
		SETRANGE("Due Date",FromDate,ToDate);
		IF FIND('-') THEN
		REPEAT
			CALCFIELDS("Remaining Amt. (LCY)");
			TotalRemainingAmount := TotalRemainingAmount + "Remaining Amt. (LCY)";
		UNTIL NEXT = 0;
	END;
	EXIT(TotalRemainingAmount);
	END;
	LOCAL PROCEDURE CalcVendNetChange@4(FromDate@1000 : Date;ToDate@1001 : Date) : Decimal;
	VAR
	VendLedgEntry@1002 : Record 25;
	TotalRemainingAmount@1003 : Decimal;
	BEGIN
	WITH VendLedgEntry DO BEGIN
		SETCURRENTKEY(Open,"Due Date");
		SETRANGE(Open,TRUE);
		SETRANGE("Due Date",FromDate,ToDate);
		IF FIND('-') THEN
		REPEAT
			CALCFIELDS("Remaining Amt. (LCY)");
			TotalRemainingAmount := TotalRemainingAmount + "Remaining Amt. (LCY)";
		UNTIL NEXT = 0;
	END;
	EXIT(TotalRemainingAmount);
	END;
	LOCAL PROCEDURE CalcBankBalance@7(EndDate@1000 : Date;VAR TotalBalance@1003 : Decimal;VAR BankCreditLimit@1002 : Decimal);
	VAR
	BankAcc@1001 : Record 270;
	BEGIN
	WITH BankAcc DO BEGIN
		SETFILTER("Date Filter",'..%1',EndDate);
		IF FIND('-') THEN
		REPEAT
			CALCFIELDS("Balance at Date (LCY)");
			TotalBalance := TotalBalance + "Balance at Date (LCY)";
			BankCreditLimit := BankCreditLimit + BankAcc."Min. Balance";
		UNTIL NEXT = 0;
	END;
	END;
	LOCAL PROCEDURE DrillDownCust@1000000002(DrillDownDate@1000000000 : Date);
	VAR
	CustLedgEntry@1000000001 : Record 21;
	BEGIN
	CustLedgEntry.SETRANGE(Open,TRUE);
	CustLedgEntry.SETRANGE("Due Date",DrillDownDate,DrillDownDate);
	PAGE.RUNMODAL(PAGE::"Customer Ledger Entries",CustLedgEntry);
	END;
	LOCAL PROCEDURE DrillDownVend@1000000004(DrillDownDate@1000000000 : Date);
	VAR
	VendLedgEntry@1000000001 : Record 25;
	BEGIN
	VendLedgEntry.SETRANGE(Open,TRUE);
	VendLedgEntry.SETRANGE("Due Date",DrillDownDate,DrillDownDate);
	PAGE.RUNMODAL(PAGE::"Vendor Ledger Entries",VendLedgEntry);
	END;
	LOCAL PROCEDURE DrillDownBank@1000000005();
	BEGIN
	PAGE.RUNMODAL(PAGE::"Bank Account List");
	END;
	BEGIN
	END.
  }
}
OBJECT Codeunit 50000 Demo Cash Flow Chart Mgt.
{
  OBJECT-PROPERTIES
  {
	Date=06-04-11;
	Time=16:08:58;
	Modified=Yes;
	Version List=Charts;
  }
  PROPERTIES
  {
	OnRun=BEGIN
		END;
  }
  CODE
  {
	VAR
	TextCust@1000 : TextConst 'ENU=Accounts Receivable';
	TextVend@1001 : TextConst 'ENU=Accounts Payable';
	TextBank@1002 : TextConst 'ENU=Bank Balances';
	TextTotal@1003 : TextConst 'ENU=Forecasted Balance';
	TextCredit@1004 : TextConst 'ENU=Credit Limit in Banks';
	TextDate@1005 : TextConst 'ENU=Date';
	PROCEDURE OnInitPage@6(VAR BusChartBuf@1000 : Record 485);
	BEGIN
	END;
	PROCEDURE GenerateData@3(VAR BusChartBuf@1000 : Record 485);
	VAR
	i@1007 : Integer;
	BankBalance@1006 : Decimal;
	CustNetChange@1005 : Decimal;
	VendNetChange@1004 : Decimal;
	TotalBalance@1003 : Decimal;
	BalanceDate@1002 : Date;
	BankCreditLimit@1001 : Decimal;
	BEGIN
	WITH BusChartBuf DO BEGIN
		SetMeasureLabel(1,TextCust);
		SetMeasureLabel(2,TextVend);
		SetMeasureLabel(3,TextTotal);
		SetMeasureLabel(4,TextCredit);
		SetChartType(1,"Chart Type"::StackedColumn);
		SetChartType(2,"Chart Type"::StackedColumn);
		SetChartType(3,"Chart Type"::Line);
		SetChartType(4,"Chart Type"::StepLine);
		SetXAxisCaption(TextDate);
		BalanceDate := WORKDATE - 1; // demo. Should be TODAY.
		CalcBankBalance(BalanceDate,TotalBalance,BankCreditLimit);
		FOR i := 1 TO 6  DO BEGIN  //  Generate 6 columns
		CustNetChange := CalcCustNetChange(BalanceDate,BalanceDate);
		VendNetChange := CalcVendNetChange(BalanceDate,BalanceDate);
		TotalBalance := TotalBalance + CustNetChange + VendNetChange;
		SetXAxisValueLabel(i,FORMAT(BalanceDate,0,9));
		SetValue(1,i,CustNetChange);
		SetValue(2,i,VendNetChange);
		SetValue(3,i,TotalBalance);
		SetValue(4,i,BankCreditLimit);
		BalanceDate := BalanceDate + 1;
		END;
	END;
	END;
	PROCEDURE OnDataPointClicked@5(VAR BusChartBuf@1000 : Record 485;PointData@1000000000 : Text[1024]);
	VAR
	VendLedgEntry@1001 : Record 25;
	DrillDownDate@1000000001 : Date;
	BEGIN
	BusChartBuf.UpdateDrillDownParams(PointData);
	DrillDownDate := WORKDATE + BusChartBuf."Drill-Down X Index" - 2; // ref. first balance date in GenerateData function
	CASE BusChartBuf."Drill-Down Measure Index" OF
		1 : // Customer
		DrillDownCust(DrillDownDate);
		2 : // Vendor
		DrillDownVend(DrillDownDate);
		4 : // Bank Credit limits
		DrillDownBank;
	END;
	END;
	LOCAL PROCEDURE CalcCustNetChange@1(FromDate@1000 : Date;ToDate@1001 : Date) : Decimal;
	VAR
	CustLedgEntry@1002 : Record 21;
	TotalRemainingAmount@1003 : Decimal;
	BEGIN
	WITH CustLedgEntry DO BEGIN
		SETCURRENTKEY(Open,"Due Date");
		SETRANGE(Open,TRUE);
		SETRANGE("Due Date",FromDate,ToDate);
		IF FIND('-') THEN
		REPEAT
			CALCFIELDS("Remaining Amt. (LCY)");
			TotalRemainingAmount := TotalRemainingAmount + "Remaining Amt. (LCY)";
		UNTIL NEXT = 0;
	END;
	EXIT(TotalRemainingAmount);
	END;
	LOCAL PROCEDURE CalcVendNetChange@4(FromDate@1000 : Date;ToDate@1001 : Date) : Decimal;
	VAR
	VendLedgEntry@1002 : Record 25;
	TotalRemainingAmount@1003 : Decimal;
	BEGIN
	WITH VendLedgEntry DO BEGIN
		SETCURRENTKEY(Open,"Due Date");
		SETRANGE(Open,TRUE);
		SETRANGE("Due Date",FromDate,ToDate);
		IF FIND('-') THEN
		REPEAT
			CALCFIELDS("Remaining Amt. (LCY)");
			TotalRemainingAmount := TotalRemainingAmount + "Remaining Amt. (LCY)";
		UNTIL NEXT = 0;
	END;
	EXIT(TotalRemainingAmount);
	END;
	LOCAL PROCEDURE CalcBankBalance@7(EndDate@1000 : Date;VAR TotalBalance@1003 : Decimal;VAR BankCreditLimit@1002 : Decimal);
	VAR
	BankAcc@1001 : Record 270;
	BEGIN
	WITH BankAcc DO BEGIN
		SETFILTER("Date Filter",'..%1',EndDate);
		IF FIND('-') THEN
		REPEAT
			CALCFIELDS("Balance at Date (LCY)");
			TotalBalance := TotalBalance + "Balance at Date (LCY)";
			BankCreditLimit := BankCreditLimit + BankAcc."Min. Balance";
		UNTIL NEXT = 0;
	END;
	END;
	LOCAL PROCEDURE DrillDownCust@1000000002(DrillDownDate@1000000000 : Date);
	VAR
	CustLedgEntry@1000000001 : Record 21;
	BEGIN
	CustLedgEntry.SETRANGE(Open,TRUE);
	CustLedgEntry.SETRANGE("Due Date",DrillDownDate,DrillDownDate);
	PAGE.RUNMODAL(PAGE::"Customer Ledger Entries",CustLedgEntry);
	END;
	LOCAL PROCEDURE DrillDownVend@1000000004(DrillDownDate@1000000000 : Date);
	VAR
	VendLedgEntry@1000000001 : Record 25;
	BEGIN
	VendLedgEntry.SETRANGE(Open,TRUE);
	VendLedgEntry.SETRANGE("Due Date",DrillDownDate,DrillDownDate);
	PAGE.RUNMODAL(PAGE::"Vendor Ledger Entries",VendLedgEntry);
	END;
	LOCAL PROCEDURE DrillDownBank@1000000005();
	BEGIN
	PAGE.RUNMODAL(PAGE::"Bank Account List");
	END;
	BEGIN
	END.
  }
}
|
|
Understanding the GenerateData Function
Codeunit 50000 accesses data in the Cust. Ledger Entry table, the Vender Ledger Entry table, and the Bank Account table. The GenerateData function generates the data for the cash flow chart. The following figure shows the C/AL code for the GenerateData function and how it maps to the cash flow chart user interface.
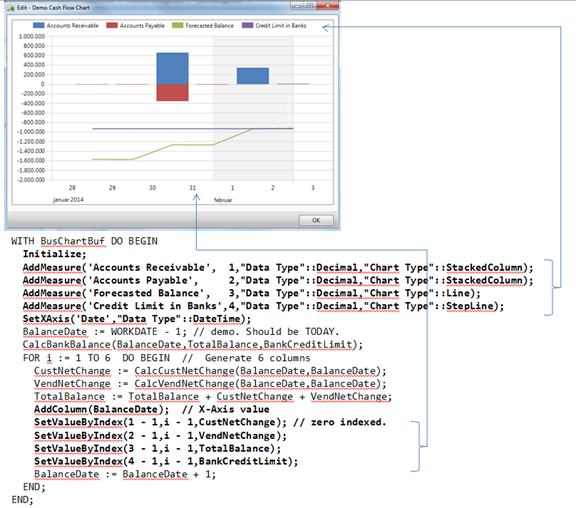
The C/AL code sets the characteristics of the cash flow chart, including measure labels, chart types, and more. The functions that are called in GenerateData function are defined in table 485 Business Chart Buffer. The following table describes the functions of the Business Chart Buffer table that you can use for defining the chart.
| Function | Description | Example |
|---|---|---|
|
AddMeasure(Caption,ValueIndex,ValueType,ChartType) |
Sets the label and type for the measure. |
AddMeasure('Acc. Receivables',1,"Data Type"::Decimal,"Chart Type"::StackedColumn); |
|
SetXAxis(Caption,Type) |
Sets the x-axis caption and value. |
SetXAxis('Date',"Data Type"::DateTime); |
|
SetXAxisCaption(Caption) |
Sets the x-axis name. |
SetXAxisCaption('Due Date'); |
|
SetValueByIndex(MeasureIndex0,Xindex0,Value) |
Sets the data point value in the chart. 0-based indexing. |
SetValueByIndex(0,0,CustNetChange); |
|
SetDrillDownIndexes(point) |
DataPointClicked |
SetDrillDownIndexes(point); |
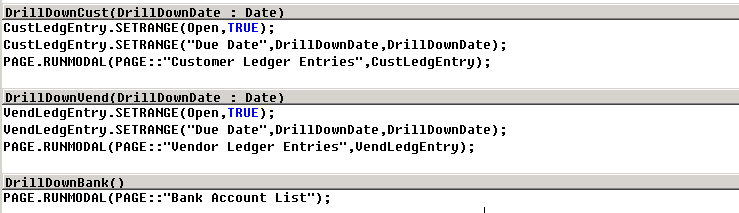
Understanding the Drill-down Logic of the OnDataPointClicked Function
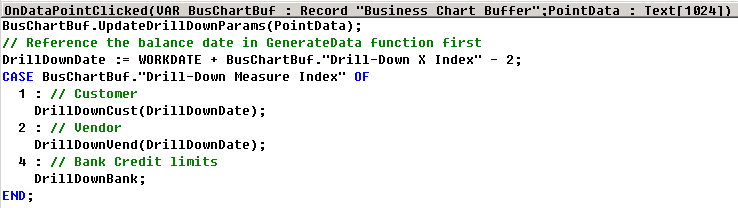
When you choose a data point or column in the cash flow chart, a list page appears that shows due customer ledger entries, vendor ledger entries, or bank accounts. To accomplish this, the OnDataPointClicked event trigger on page 50000 Demo Cash Flow Chart is passed to the point object as a parameter. The point can then be passed on to the SetDrillDownIndexes(point) function that updates the Drill-Down X Index and Drill-Down Measure Index fields on the record. You use the Drill-Down X Index and Drill-Down Measure Index fields to retrieve the x-axis value and measure value for filtering the list that you want to display. The following figure shows the C/AL code on the OnDataPointClicked function.
The OnDataPointClicked function calls the DrillDownCust function, DrillDownVend function, and DrillDownBank function, which are shown in the following figure.