
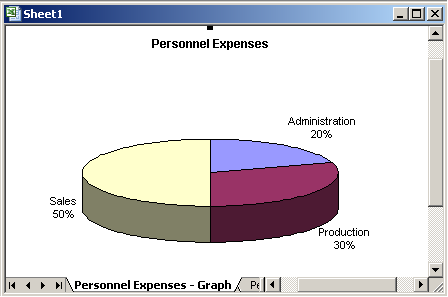
In this walkthrough, you will transfer data from the G/L Entry table to Microsoft Office Excel and create a graph. This example shows how to handle enumerations by creating a graph in Excel that shows the distribution of personnel expenses by departments. In the Chart of Accounts, you can see that Total Personnel Expenses is the total of accounts 8700 to 8790. In the Dimension Value table, you can see that there are three departments: ADM, PROD, and SALES. You will create a codeunit that retrieves this data from the G/L Entry table, transfers it to Excel, and creates a graph that is similar to the one that is shown in the following figure:
You will run the codeunit directly from Object Designer. In a real application, you would call it from an appropriate place, such as from a menu in the Chart of Accounts window.
 About This Walkthrough
This walkthrough illustrates the following tasks:
-
Creating a codeunit that declares the Automation variables that are required for using Excel Automation.
-
Adding C/AL code to the codeunit to run the Automation object that opens Excel.
-
Adding C/AL code to the Automation codeunit to transfer data from a table record to Excel.
-
Adding C/AL code that creates a graph in Excel.
Prerequisites
To complete this walkthrough, you will need:
-
Microsoft Dynamics NAV 2009 with a developer license.
-
The CRONUS International Ltd. demo data company.
-
Microsoft Office Excel 2007 or Microsoft Excel 2003.
Creating the Codeunit and
Declaring Variables
To implement Automation in a codeunit, you define the Automation variables. To define an Automation variable, you specify an Automation server and the Automation object.
To create the codeunit and declare variables
-
In Object Designer, click Codeunit, and then click the New button to create a new codeunit.
-
On the View menu, click C/AL Globals.
-
On the Variables tab, add the following variables:
 Note
NoteFor the Automation data type variables, the subtype Microsoft Excel 11.0/12.0 Object Library defines the Automation server, and the class specifies the Automation object of the Microsoft Excel 11.0/12.0 Object Library. Microsoft Excel 11.0 or 12.0 Object Library.
Name Data type Subtype Class GLEntry
Record
G/L Entry
xlApp
Automation
Microsoft Excel 11.0 or 12.0 Object Library
Application
xlBook
Automation
Microsoft Excel 11.0 or 12.0 Object Library
Workbook
xlSheet
Automation
Microsoft Excel 11.0 or 12.0 Object Library
Worksheet
xlChart
Automation
Microsoft Excel 11.0 or 12.0 Object Library
Chart
xlRange
Automation
Microsoft Excel 11.0 or 12.0 Object Library
Range
-
Close the C/AL Globals window.
Adding the Code
Now you add the code for the codeunit.
To add the code
-
In the C/AL Editor, set the key for the G/L Entry table, and then use
SETFILTERto select the accounts by adding the following code. Copy Code
GLEntry.SETCURRENTKEY("G/L Account No.","Business Unit Code", "Global Dimension 1 Code","Global Dimension 2 Code","Posting Date"); GLEntry.SETFILTER("G/L Account No.",'8700..8790'); -
Create an instance of Excel by adding the following code.
Copy CodeCREATE(xlApp);
-
Add a new workbook to Excel.
Copy CodexlBook := xlApp.Workbooks.Add(-4167); xlSheet:= xlApp.ActiveSheet; xlSheet.Name := 'Personnel Expenses';
The following describes the code:
-
In the first line, you use the
Addmethod of theWorkbookscollection to return a new workbook. The attribute-4167is the enumerator value of worksheets as they apply to Workbook objects. For more information, see About the Enumerator Value. -
In the second line, you use the
ActiveSheetproperty of the Application class to ensure that what is done next affects the active sheet of the new workbook. -
In the third line, you use the
Nameproperty to name the sheet.
-
About the Enumerator Value
In the preceding procedure, the Add method includes the
attribute -4167. In the Microsoft Excel Visual Basic
online Help, the Add method as it applies to the
Workbooks object takes one Template argument, which
is of type VARIANT. The description in the Help says:
If this argument is a constant, the new workbook contains a single sheet of the specified type. Can be one of the following: XlWBATemplate constants: xlWBATChart, xlWBATExcel4IntlMacroSheet, xlWBATExcel4MacroSheet, or xlWBATWorkSheet.
Instead of passing xlWBATWorkSheet as the Template argument, you are passing the number -4167. In this case, the Template argument, which is of type VARIANT, is an enumeration. Enumerations are either USERDEF types or not. This is not a USERDEF type, so it looks like a VARIANT in the C/AL Symbol Menu. You have to look in the Microsoft Excel Visual Basic Help to figure out that it is actually an enumeration. Arguments can be constants with names like xl* in Excel, wd* in Word, and ol* in Outlook. In C/SIDE, you cannot use the symbolic name xlWBATWorkSheet. You have to use the enumerator -4167.
To find an enumerator value
-
Open Excel and do one of the following steps to open the Visual Basic Editor.
-
In Excel 2007, on the Developer tab, click Visual Basic.
NoteIf you do not see the Developer tab, then click the Microsoft Office Button in the upper left corner, and then click Excel Options. In the Popular category, under Top options for working with Excel, select the Show Developer tab in Ribbon check box, and then click OK.
-
In Excel 2003, on the Tools menu, click Macro, and then click Visual Basic Editor.
-
-
On the View menu, click Object Browser.
-
In the Project/Library list in the list box in the upper-left corner of the Object Browser, select Excel.
-
In the Classes list, select XlWBATemplate.
-
In the Members of ‘XlWBATemplate’ list, select xlWBATWorkSheet. The value can now be seen in the information pane at the bottom of the Object Browser.
Transferring Data
To transfer the data, you must calculate the data and transfer the results of the calculation.
To transfer data
-
In the C/AL Editor, on the codeunit, use
SETRangeto filter the entries in the G/L Entry table on the Global Dimension 1 Code field. The first department is ADM (Administration). Then, you useCALCSUMS(Amount)to get the sum for the ADM department. To do this, add the following code.Copy CodeGLEntry.SETRANGE("Global Dimension 1 Code", 'ADM'); GLEntry.CALCSUMS(Amount); -
To transfer the data to Microsoft Excel, add the following code.
Copy CodexlSheet.Range('A2').Value := 'Administration'; xlSheet.Range('A3').Value := GLEntry.Amount; -
Add this code for the PROD and SALES departments:
Copy CodeGLEntry.SETRANGE("Global Dimension 1 Code", 'PROD'); GLEntry.CALCSUMS(Amount);Copy CodexlSheet.Range('B2').Value := 'Production'; xlSheet.Range('B3').Value := GLEntry.Amount;Copy CodeGLEntry.SETRANGE("Global Dimension 1 Code", 'SALES'); GLEntry.CALCSUMS(Amount);Copy CodexlSheet.Range('C2').Value := 'Sales'; xlSheet.Range('C3').Value := GLEntry.Amount; -
Save and compile the codeunit.
Creating the Graph
The final step is to create the graph. You will use the ChartWizard method to create a 3-D pie chart. This is a fast and simple way to do it. You can more tightly control the design of the graph by setting it up using the methods and properties of the various Chart objects, such as ChartArea and Legend.
To create the graph
-
In the C/AL Editor, on the current codeunit, define a range for the data in the graph.
Copy CodexlRange := xlSheet.Range('A2:C3'); -
Add a new chart sheet and give it a name.
Copy CodexlChart := xlBook.Charts.Add; xlChart.Name := 'Personnel Expenses - Graph';
-
Create the graph.
Copy CodexlChart.ChartWizard(xlRange,-4102,7,1,1,0,0,'Personnel Expenses');
-
Use the following optional arguments in the
ChartWizardmethod.Argument Description Value in method call Source
The range that contains the source data for the new chart.
xlRange – The object returned by xlSheet.Range(‘A2:C3’).
Gallery
The chart type.
-4102 – The enumerator for the xl3DPie XlChartType enumeration.
Format
The option number for the built-in auto formats.
7
PlotBy
An integer specifying whether the data for each series is in rows or columns.
1 – The enumerator for the xlRows XlRowCol enumerator.
CategoryLabels
An integer specifying the number of rows or columns within the source range that contains category labels.
1 – There is one row with category labels (the department names).
SeriesLabels
An integer specifying the number of rows or columns within the source range that contains series labels.
0 – There are no series labels in your data.
HasLegend
TRUE to include a legend.
0
Title
VARIANT with the title of the chart.
You pass a string such as ‘Personnel Expenses’.
-
Make Excel visible by adding the following code.
Copy CodexlApp.Visible := TRUE;
Excel produces a General Protection Fault error when you close a new Excel worksheet that is created when Excel is invisible. To resolve this, you can make Excel visible immediately after you create a new worksheet. You can also make Excel visible just before you create a new Excel worksheet and then make it invisible again immediately after creating the new Excel worksheet. In this case, you would add the following code.
Copy CodexlApp.Visible := TRUE; xlBook := xlApp.Workbooks.Open(FileName); xlApp.Visible := FALSE;
See Also
© 2010 Microsoft Corporation. All rights reserved.